NOT FINANCIAL ADVICE: I am not a certified financial advisor, registered investment advisor, or licensed financial professional. The trading signals displayed on this website are for informational and educational purposes only.
Seek Professional Advice: Before making any investment decisions, you should consult with a qualified financial advisor, accountant, or other professional who can provide advice tailored to your individual circumstances.
Cryptocurrency Volatility: Cryptocurrencies are among the most volatile assets in the world. Prices can experience extreme fluctuations and may decline by 99% or more. You could lose your entire investment.
SEC & CFTC Disclaimers:
Past performance does not guarantee future results.
All investments carry risk of loss, including the potential loss of principal.
Cryptocurrency markets are largely unregulated and may be subject to manipulation.
Trading cryptocurrencies involves substantial risk of loss and is not suitable for all investors.
You should only invest money you can afford to lose.
Risk Management: Manage your risk accordingly. Never invest more than you can afford to lose. Use proper position sizing, stop-loss orders, and risk management techniques.
Security Warnings:
Hold Your Own Keys: Always maintain control of your private keys and seed phrases. Never share them with anyone, including this website or any service.
Website Permissions: Be extremely careful when granting websites or applications permission to access your cryptocurrency wallets or funds. Only connect to trusted, verified services.
Phishing Scams: Be vigilant against phishing scams. Always verify website URLs, never click suspicious links, and never enter your private keys or seed phrases on any website.
No Liability: This website and its operators are not responsible for any losses, damages, or security breaches that may occur from using the information displayed here.
No Guarantees: Trading signals are not guarantees of profit. Market conditions can change rapidly, and past signals do not predict future performance.
🚀 Premium Trading Signals
Get unlimited access to all trading signals with our premium subscription.
Bitcoin's market cap as % of total crypto market cap
📊 Understanding Bitcoin Dominance
What it measures: Bitcoin dominance shows how much of the total cryptocurrency market cap belongs to Bitcoin. When it's high (e.g., 60%+), Bitcoin controls most of the market.
Rising dominance (above 2 EMA): Capital is flowing from altcoins into Bitcoin. This is typically bearish for altcoins - they tend to underperform or decline. The bot blocks buy signals during rising dominance to protect you from poor entry timing.
Falling dominance (below 2 EMA): Capital is flowing from Bitcoin into altcoins. This is typically bullish for altcoins - they tend to outperform. The bot allows buy signals during falling dominance when conditions are favorable.
Why it matters: Bitcoin dominance reflects market risk appetite. When investors are risk-averse, they flock to Bitcoin (the "safe haven" of crypto). When they're risk-on, they chase altcoin gains.
How the bot uses it: The bot calculates a 2-period EMA of Bitcoin dominance and compares it to the current value. This filter helps avoid buying altcoins when Bitcoin is likely to outperform, improving your entry timing.
🚨 RISING BITCOIN DOMINANCE WARNING
Bitcoin dominance is trending upwards, which typically indicates that capital is flowing from altcoins back into Bitcoin.
⚠️ Exercise extreme caution when taking altcoin long positions during rising Bitcoin dominance. Consider:
Avoiding or reducing altcoin long positions when dominance is rising
Waiting for Bitcoin dominance to stabilize or decline before entering altcoin longs
Using tighter stop-losses on any existing altcoin positions
Focusing on Bitcoin or stablecoins during dominance uptrends
Remember: When Bitcoin dominance rises, altcoins typically underperform or decline
⏳ Collecting Data
Collecting Bitcoin dominance data to determine trend. Check back in a few minutes.
🚀 Crypto Signals
⏳ Waiting for signals...
📊 Stock Signals
Stocks and ETFs are long-term plays, so signals remain valid for extended periods. Recent stock signals from the past week are shown below.
⭐ My Watchlist
Get browser notifications and sound alerts when your watched symbols change signals. Click the ⭐ button on any signal card to add it to your watchlist.
No symbols in watchlist yet. Add symbols using the ⭐ button on signal cards.
📊 Market Breadth Indicator
Percentage of scanned assets showing BUY vs SELL signals based on multi-indicator analysis
Loading market breadth...
🏆 Top 3 Stock Signals (Best of the Day)
📊 Signal Thresholds Explained
BUY Threshold: ≥16/38 indicators (≈42%) must agree SELL Threshold: ≥13/37 indicators (≈35%) must agree
💡 These are the best signals from today's scan, even if they don't meet the full threshold.
On quiet market days, these represent the strongest setups available. Ideally, you would want to be patient and only act on signals that meet the thresholds, which have been backtested for maximum efficiency: not too afraid to act, but also not over-trading.
🟢 Top 3 BUY Signals
⚠️ It is the weekend, stock market closed. Data may be stale from last trading day.
Loading...
🔴 Top 3 SELL Signals
⚠️ It is the weekend, stock market closed. Data may be stale from last trading day.
Loading...
⏳ Loading stock signals...
📋 Asset List - Latest Signals
Find your favorite asset below to see its most recent trading signal. This view shows the latest signal for each asset, making it easy to check the current status of any asset you're tracking.
💎 Cryptocurrencies
⏳ Loading crypto assets...
📈 Stocks & ETFs
⏳ Loading stock assets...
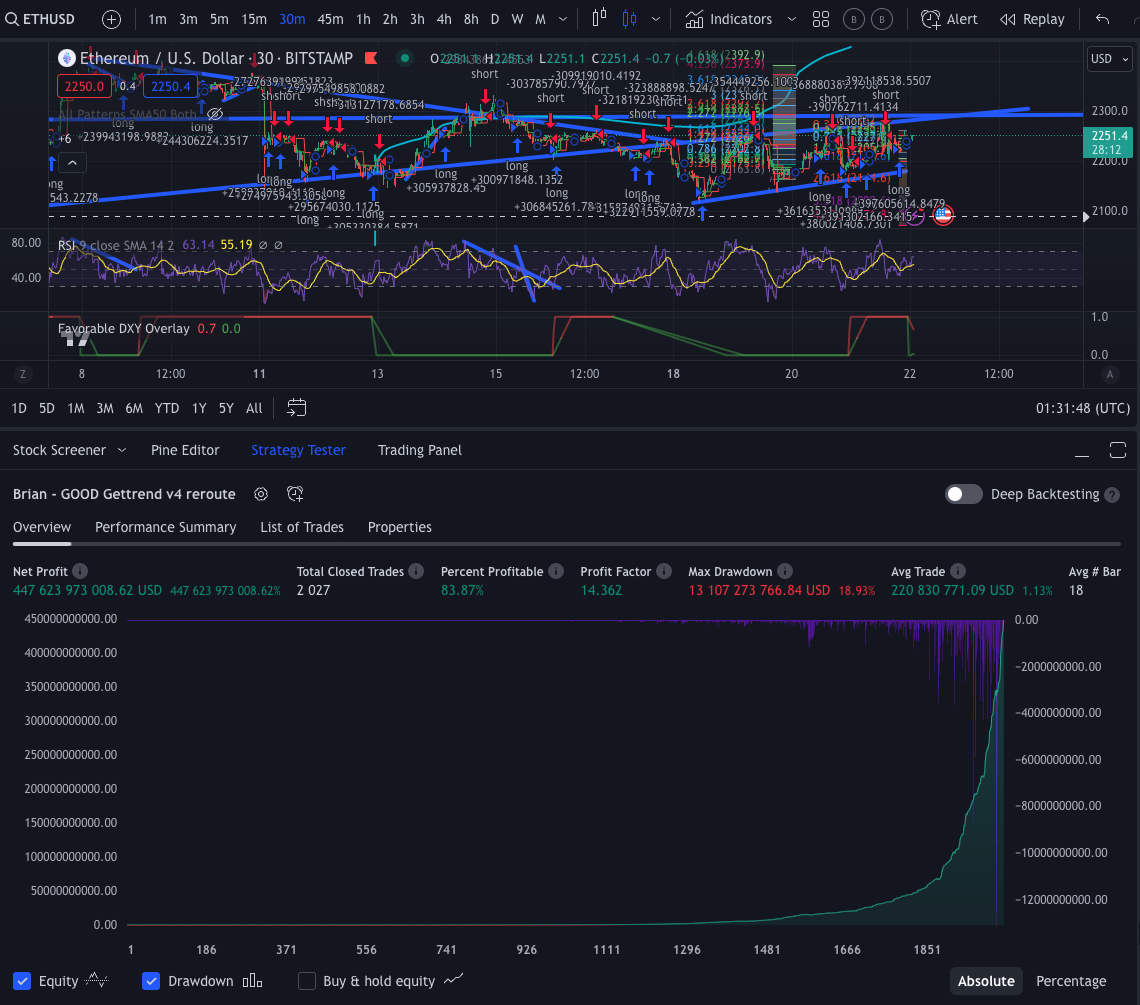
📈 Backtest Performance
Now I could lie to you and tell you that this is real. Unfortunately this is overly optimistic because of repainting.
HOWEVER, I started to ponder how I could solve the problem.
The solution: Delay the bot intentionally to have it look back in time to see if the signal was REAL and to crunch the numbers on historical data that can NO LONGER BE CHANGED. On the backend, I have preliminary signals that fire, but they will only be shown on this website once enough time has passed by, and once enough signal confluence becomes true.
This is a big reason that led to the double filtering strategy—first TradingView, then have Python code to help watch the trade to make sure everything is going to plan and it is not a repainting volatile fake-out. The other big reason for Python code? Sophisticated AI algorithms that are not possible in TradingView.
That being said, 447,623,973,008% ROI💰 with
83.87% accuracy,
14.362 Profit Factor is INSANE, and I am INSANE for giving this away for FREE.
When Blackrock finds out about this, they'll certainly make me "sleep with the fishes." 🐟💀
Even if I am an idiot that's bad at math: the bot performing 10x WORSE than this IS STILL turning ONE DOLLAR into $44,700,000 🤯. Broker commissions INCLUDED at 0.07%.
Still need more proof? I ran Monte Carlo tests. That means I even ran the bot through alternate versions of history. What if Bitcoin was at $2 right now, would the bot still have made money? Yes, the bot is still successful in alternate versions of history, so I didn't shoot the arrow first and then draw a bullseye around it. This helps to avoid future knowledge or over-fitting hard-coded bias.
In fact, the backtests were so good that I caused TradingView to have errors and I had to start putting the starting capital at $1.00.
If I put $1,000 starting capital, TradingView's UI would break!Also, that backtest image is from 3 years ago, we are now up to 350,000+ lines of code and we have created a monster. Imagine what I can do now! 🚀
Past performance does not guarantee future results. All trading involves risk.
See full disclaimer for important risk information.
💡 How to Use These Signals
📊 Understanding Multiple Signals
You may notice multiple signals appearing at the same time for a given ticker. This is a feature, not a bug.
The System uses built-in position sizing based on how many indicators are confirming the signal. When multiple indicators align, it indicates stronger conviction, and the system automatically scales position size accordingly.
Buy positions can be pyramided up to 3 times - As more indicators confirm the signal, additional buy signals may appear, allowing you to scale into the position with increasing confidence. The different tickers all trading is position sizing even more. If multiple signals fire on different assets, that scales in even more. A perfect dollar-cost-average strategy.
Sells are always 100% of the position - When a sell signal appears, it represents a complete exit of the position, regardless of how many buy signals were used to build it
More signals = Higher conviction - Multiple simultaneous signals indicate stronger confluence and higher probability setups
🛡️ Understanding Stop Losses (Risk Management, Not Bearish Signals)
Important: If you see a sell signal with a -3% loss, this is NOT because the bot is bearish on the asset. This is our fixed stop loss protection - a "guardian angel" that prevents large losses.
How it works: The bot uses multiple stop loss systems working together to protect your capital:
Fixed 3% Stop Loss - Hard floor that never allows more than 3% loss per trade. This is checked FIRST and acts as your ultimate safety net.
ATR Trailing Stop - Dynamically adjusts based on volatility, protecting profits as they develop while allowing trends to run.
Trend Exhaustion Detection - Exits when parabola patterns break or trend strength (ADX) weakens significantly.
Why this matters: Professional traders use stop losses not because they're bearish, but because capital preservation is more important than being right. A -3% loss is much better than a -10% or -20% loss. This is capital efficiency and risk management, not a bearish signal. The bot is protecting you from catastrophic losses so you can live to trade another day.
🎯 Signal Timing Philosophy
Wait for Confirmation (Recommended)
Don't rush the entry - Give signals a few hours to confirm the move is real. Consider starting with a smaller position (25-50% of your intended size) and adding to it as the move confirms through price action, additional indicators, or time. This scaling approach lets you participate while managing risk.
Being 3-12 hours late on the signal is actually a good thing, and is the sweet spot IF the directional bias seems to be playing out correctly. The more time passes by, the more the massive suite of indicators get carved into stone and can't be undone.
Understanding "Repainting": There's a phenomenon called repainting, which is when live prices are moving so fast that the signal "changes its mind." In order to mitigate repainting, consider slowly scaling in as you feel the move gets more and more confirmed. Of course, the market is filled with manipulation and "short squeezes," so this thinking helps mitigate that risk.
Reality check: It's next to impossible to completely eliminate this—it's just the nature of trading. An asset can have a +50% move and then take it all back in the SAME candle. That's part of the game. This is why we emphasize position sizing and scaling, not all-or-nothing entries.
Avoid fake-outs - Extreme volatility can create false signals that reverse quickly
Let the move develop - The best traders don't try to catch the perfect bottom or top
Patience pays - A confirmed trend is worth more than catching the first tick
Anti-Repainting Proof
Repainting is when trading systems retroactively change or delete past signals to make their performance look better.
We explicitly prevent this through transparency:
Permanent timestamps - Every signal gets an immutable ISO 8601 timestamp the moment it's generated
Never deleted - Signals are archived (not removed) after 4 days, providing long-term proof
The longer signals age - The more proof they provide that we haven't edited or manipulated them
GitHub commit history - Every update to signals.json is version-controlled with commit timestamps
What you see is what was generated - No cherry-picking, no editing, no hiding bad calls
💡 Professional Trader Mindset
The best traders understand that:
Not every signal will be profitable - That's trading. Even 55-60% win rate with proper risk management is excellent
Confirmation > Speed - Missing the first 2% of a move to gain 80% confidence is a good trade-off
Risk management matters most - The bot uses multiple stop losses (fixed 3% hard floor, ATR trailing stops, trend exhaustion detection) to protect capital. A -3% loss is not a bearish signal - it's capital efficiency and protection.
The trend is your friend - Signals work best when aligned with higher timeframe trends
Patience wins - Let high-probability setups come to you rather than forcing trades
📈 Stock Strategy vs Crypto Strategy
The stock strategy is different code than crypto. The stock strategy emphasizes trend while the crypto strategy is much more of a mean reversion strategy.
Buy into strength for stocks - Stocks mostly trend forever. When you see a strong uptrend signal, the momentum is likely to continue. Follow the trend and add to positions as they move in your favor.
Buy into weakness for crypto - Crypto is much more of a roller coaster ride. Mean reversion strategies work better here. When crypto drops significantly, that's often the best time to buy, as it tends to bounce back.
Different mindsets - Stocks reward trend-following patience. Crypto rewards contrarian thinking and buying the dip.
🚀 Why This Is Different
💰 Become a Quant Trader Without the Complexity
Access institutional-grade trading signals in the most lucrative asset class in human history
Large funds don't trade crypto - creating a huge opportunity for retail traders
No math or coding experience required - only $9.99
Massive opportunity cost of manually staring at charts all day instead of focusing on family, friends, and your career
Human emotions are your enemy: Can you really stay emotionless after losing $5,000 in a month? Will you avoid revenge trading?
AI outperforms human traders: Can you buy when crypto drops -50% even when analysis says you should? Can you sell when everyone's bragging about gains?
Chart > News: The chart tells the story, not the news. Big players use news to make you buy tops and sell bottoms
AI is revealing Wall Street's secrets: This secretive industry is finally being democratized
⚠️ Stay Safe: Watch Out for Scams
Be careful of the scams that say you can make 2 ETH a day with arbitrage. 99% of them are scams trying to trick you into downloading their wallet drainer. These malicious programs can drain your entire crypto wallet the moment you connect it.
No sketchy code to download or install that can drain your account. Simply visit this page to take advantage of institutional hedge fund grade code tirelessly hunting down the best trades for you.
✅ What Makes This Safe and Legitimate
No downloads required - Just visit this page, no software to install. I will never ask for passwords/seed phrase. Never share these to anyone. Pro tip: Have a separate device with only $100 of crypto with a fresh seed phrase for "exploring".
No wallet connections - We never ask you to connect your wallet
Transparent signals - All signals are publicly visible with permanent timestamps
Institutional-grade code - Professional trading algorithms working 24/7
Simple one-time payment - Just $9.99 one-time payment (limited time offer) for permanent access to all signals through secure https payment with Stripe. (crypto payments coming soon!). I'm not hiding behind an alias Moonboy777, I'm using my legal name. Bloomberg Terminal costs $2,500 a month, Refinitiv $2,200 a month, Motley Fool $2,000 a year, TrendSpider $1,500 a year, TradingView Premium $599 a year, Trading courses are often $3,000+. You'll spend more on coffee this month than this costs.
Assets Traded
We focus on a curated selection of assets to ensure quality analysis and signal generation. Below are the specific ticker symbols we actively monitor and trade.
CRYPTOCURRENCIES
Cryptocurrency selection is based on extensive backtesting analysis. These tokens have demonstrated the strongest historical performance and signal reliability in the trading system:
BTC/USD - Bitcoin: The original and largest cryptocurrency, serving as digital gold and a store of value with the highest market capitalization
ETH/USD - Ethereum: The second-largest cryptocurrency and leading smart contract platform, powering the majority of DeFi and NFT ecosystems
SOL/USD - Solana: High-performance blockchain with fast transaction speeds and low fees, popular for DeFi and NFT applications
DASH/USD - Dash: Privacy-focused cryptocurrency with instant transactions, decentralized governance, and optional private send features
TAO/USD - Bittensor: Decentralized AI network token powering machine learning models and neural networks through distributed computing
BONK/USD - Bonk: Meme coin on the Solana blockchain with strong community engagement and high volatility
CRV/USD - Curve DAO Token: Governance token for Curve Finance, a leading DeFi protocol specializing in stablecoin swaps and liquidity pools
SUI/USD - Sui: Next-generation blockchain platform designed for high throughput and low latency, focusing on gaming and DeFi applications
AERO/USD - Aerodrome: DeFi protocol token on Base blockchain, providing liquidity and yield farming opportunities
RNDR/USD - Render Token: Decentralized GPU rendering network connecting artists with distributed computing power for 3D rendering
AAVE/USD - Aave: Leading DeFi lending protocol token, enabling users to lend and borrow cryptocurrencies with competitive interest rates
These cryptocurrencies were selected based on comprehensive backtesting results showing optimal signal performance and trading outcomes.
STOCKS & ETFs
Stock strategy focuses on sector ETFs, benchmarks, and select individual stocks:
US Sector ETFs
XLK - Technology Select Sector SPDR Fund
XLY - Consumer Discretionary Select Sector SPDR Fund
XLP - Consumer Staples Select Sector SPDR Fund
XLI - Industrial Select Sector SPDR Fund
XLB - Materials Select Sector SPDR Fund
XLRE - Real Estate Select Sector SPDR Fund
XLU - Utilities Select Sector SPDR Fund
XLC - Communication Services Select Sector SPDR Fund
XLF - Financial Select Sector SPDR Fund
XLV - Health Care Select Sector SPDR Fund
XLE - Energy Select Sector SPDR Fund
Specialized Sectors
SOXX - iShares Semiconductor ETF
Individual Stocks
NVDA - NVIDIA Corporation
F - Ford Motor Company
Benchmarks
SPY - SPDR S&P 500 ETF Trust
IBIT - iShares Bitcoin Trust ETF
Precious Metals
GLD - SPDR Gold Trust
SLV - iShares Silver Trust
PPLT - Aberdeen Standard Physical Platinum Shares ETF
PALL - Aberdeen Standard Physical Palladium Shares ETF
Energy
USO - United States Oil Fund
International & Credit
EEM - iShares MSCI Emerging Markets ETF
PCEF - Invesco CEF Income Composite ETF
HYG - iShares iBoxx $ High Yield Corporate Bond ETF
Country/Region ETFs
MCHI - iShares MSCI China ETF
INDA - iShares MSCI India ETF
EWJ - iShares MSCI Japan ETF
EWG - iShares MSCI Germany ETF
EWT - iShares MSCI Taiwan ETF
📊 Comprehensive Indicator Analysis
Trading signals are generated using a sophisticated multi-indicator confluence approach (as you are about to see, it is a seemingly never-ending list of indicators).
TREND INDICATORS
Moving Averages
EMA (Exponential Moving Average)
Fast EMA (12-period) - short-term trend
Slow EMA (26-period) - medium-term trend
EMA 13 - megabot trend direction
EMA 21 - megabot secondary trend
EMA 195 - long-term trend filter
SMA (Simple Moving Average)
SMA 18 - short-term average
SMA 20 - standard trend line
SMA 50 - medium-term trend (BTC halving analysis)
SMA 200 - long-term trend (BTC halving analysis)
Hull Moving Average (HMA) - Base length 8, scalar 5 - smoothed trend following
Guppy GMMA (Multiple Moving Averages) - Multiple EMA layers for trend confirmation
Trend Strength & Direction
ADX (Average Directional Index) - Helps the bot avoid getting in and out of trades doring horizontal consildation price action. 14-period ADX for trend strength measurement, ADX thresholds: 7-8 for shorts, 8+ for longs, ADX Divergence - price vs trend strength divergence
Parabolic SAR - Acceleration 0.02, maximum 0.2 - dynamic stop and reverse
Ichimoku Cloud - Tenkan (9-period), Kijun (26-period), Senkou A/B (52-period), Chikou span, cloud thickness analysis, comprehensive trend system with support/resistance
SuperTrend - ATR-based trend following with dynamic stop levels, Factor 3.0, ATR period 10, SuperTrend Slope Divergence - price vs trend slope divergence
Directional Movement - +DI and -DI components for trend direction, DX (Directional Index) calculation
MegaBot Crossover System - Higher timeframe close vs open crossover (720-minute default), 34-period SMA on higher timeframe, Multi-timeframe trend confirmation
MOMENTUM INDICATORS
Oscillators
🔍 Understanding Divergences (Simple Explanation)
What is a divergence? A divergence occurs when the price moves in one direction, but the underlying buying or selling pressure moves in the opposite direction.
In simple terms: We're finding moments where there are fewer buyers (or less buying pressure), yet the price still went up. This is a warning sign that the price move might be weak or unsustainable.
Conversely, if prices are falling but buying pressure is increasing, it could signal a potential reversal. Divergences help us spot when price movements might be running out of steam before the average trader notices. The added beauty of this: less hard-coding (knowing history too well A.K.A. over-fitting) and it is a more robust strategy between asset classes.
RSI (Relative Strength Index) - 14-period standard RSI, 7-period fast RSI (SuperTrend variant), 21-period slow RSI (SuperTrend variant), RSI Divergence (regular and hidden bullish/bearish), RSI momentum filter for regime detection
Stochastic Oscillator - Standard momentum indicator comparing closing price to price range over a period, %K and %D lines, overbought/oversold conditions (TradingView Technical Rating component)
MACD (Moving Average Convergence Divergence) - MACD1: Fast 12, Slow 26, Signal 9 (standard), MACD2 (Impulse MACD / LazyBear): 34-period SMMA-based, MACD Histogram analysis, MACD Divergence (regular and hidden), MACD crossover signals (up/down, above/below zero)
Williams %R - 14-period momentum oscillator (-100 to 0 scale), Williams %R Divergence
CCI (Commodity Channel Index) - 20-period CCI (-200 to +200 scale), CCI Divergence
Bollinger Bands - Volatility-based envelope indicator using standard deviation:
How it works: Middle band is 20-period SMA, upper/lower bands are ±2.0 standard deviations from the middle band
Configuration: 20-period, 2.0 standard deviations
Analysis features: Band width analysis, Bollinger Band Width Divergence, Squeeze detection (threshold 0.1), Bounce detection (threshold 0.2)
Purpose: Identifies overbought/oversold conditions and volatility expansion/compression - bands widen during high volatility and contract during low volatility
Keltner Channels - Volatility-based envelope indicator using ATR:
How it works: Middle band is 20-period EMA, upper/lower bands are ±2.0 ATR from the middle band
Purpose: Similar to Bollinger Bands but uses ATR instead of standard deviation, providing trend-following support/resistance levels that adapt to volatility - used in TTM Squeeze detection
How it works: When Bollinger Bands are inside Keltner Channels (BB < KC), volatility is compressed, indicating a potential explosive move is building
Calculation: Compares BB upper band (SMA + 2×std dev) to KC upper band (EMA + 1×ATR), squeeze detected when difference < 0
Trading application: Used as an alternative strength condition to ADX in long entry signals (bear halving periods), can be toggled via gate_allowTTMSqueeze
Strategy purpose: Identifies low volatility periods (squeezes) that often precede high volatility breakouts, helping time entries before major moves
Why it matters: Low volatility periods compress price action, and when the squeeze releases, it often results in strong directional moves - entering during or just after a squeeze can capture these explosive moves
RVOL (Relative Volatility) - Short-term ATR (5) vs Long-term ATR (14), Threshold 0.78 for volatility alerts
Advanced Volatility Analysis
GAPO (Gopalakrishnan Range Index) - Real vs noisy trend detection, Base length 5, Min-Max normalization [-1,1], Z-score normalization with tanh clamping
Hurst Exponent (referenced for future implementation)
Detrended Price Oscillator (referenced for future implementation)
VOLUME INDICATORS
Volume Analysis
Volume SMA Ratio - 20-period volume vs 20-period SMA, Volume confirmation threshold (1.1x default)
Fibonacci Retracements - 0.382, 0.500, 0.618, 0.764, 0.854 levels, 150-bar lookback for high/low, Fib 0.382 avoid-long band (1% underneath)
Round Number Avoidance - Unique indicator that identifies psychologically significant price levels. For example, BTC crossing $20,000 or $100,000 is a HUGE event and many traders pile in limit sell orders around those zones. Only trades once price is convincingly above or below the round number by 1%. Multiples of 50, 100, 1000, 10000 are monitored with proximity range (3 points default).
CANDLESTICK PATTERNS 📊
Pattern Recognition Suite
Shooting Star 🐻 📉 - Long top wick (Bearish)
Bull Hammer 🐂 📈 - Long bottom wick (Bullish)
Marubozu - Full bodied candle (strong directional signal)
Doji - Flat candle (indecision)
Engulfing - Next candle overtakes the previous (strong reversal signal)
3 Bull Soldiers 🐂 📈 - 3 green candles in a row (strong bullish momentum)
3 Bear Soldiers 🐻 📉 - 3 red candles in a row (strong bearish momentum)
💡 Unique Anti-Trade Approach
The clever twist: Candlestick patterns are sometimes used as anti-trades rather than direct signals.
For example, if a bearish shooting star appears, we do NOT take a long trade. This approach recognizes that candlestick patterns can be medicore signals on their own because they can just be noise on low timeframes.
Instead, we use them to filter out bad trades - if a bearish pattern forms, we avoid bullish entries, and vice versa. This helps prevent entering trades when the market structure suggests weakness.
Pattern Filters
Body size threshold - 10% of range minimum
Lower lows confirmation - Pattern validation
Star pattern detection - 78.6% threshold for wick-to-body ratio
ELLIOTT WAVE & HARMONIC PATTERN ANALYSIS
Elliott Wave Patterns
Motive Waves (1-2-3-4-5) - Bullish and bearish impulse patterns, Wave vaAdvicelidation (W3 != min of W1, W3, W5), Wave structure confirmation
Corrective Waves (A-B-C) - Bullish and bearish corrective patterns, Fibonacci-based validation (0.854 threshold), Box pattern for corrective waves
🎯 The Anti-Signal Approach: Where the Real Edge Lies
The cleverness: Elliott Wave and Harmonic Patterns are implemented as anti-signals rather than direct trade triggers. This is a sophisticated risk management approach that most trading systems completely miss.
How it works: When a bearish harmonic pattern or Elliott Wave structure is detected, the system blocks buy signals for a time-limited window (typically 2-4 hours). Conversely, when a bullish pattern appears, sell signals are blocked. This prevents entering trades that go against powerful pattern-based market structure, even when other indicators might suggest a trade.
Why this matters: Pattern recognition systems are notoriously difficult to code correctly because they require understanding market psychology, Fibonacci relationships, and complex geometric rules. Most algorithmic traders avoid them entirely because they're too complex. But this complexity is exactly what creates the edge - by using these patterns to filter out bad trades rather than generate new ones, we're leveraging sophisticated market structure analysis that most competitors simply don't have.
The Edge: Elliott Wave and Harmonic Pattern analysis requires implementing hundreds of rules, multiple Fibonacci retracement and extension levels, complex geometric pattern validation, and understanding wave structure relationships. This level of complexity means most quantitative trading systems and algorithms simply don't include these patterns at all. By having this capability and using it as an anti-signal filter, we're operating with a layer of market structure analysis that most competitors cannot replicate.
⚙️ Technical Implementation Complexity
Why These Patterns Are Extremely Difficult to Code:
Hundreds of Rules: Elliott Wave theory requires validating wave relationships (e.g., Wave 3 cannot be the shortest, Wave 4 cannot overlap Wave 1 in impulse patterns), corrective wave structures, and pattern invalidation conditions
Multiple Fibonacci Levels: Harmonic patterns require precise Fibonacci ratios (0.382, 0.500, 0.618, 0.786, 0.886, 1.272, 1.414, 1.618) to be validated simultaneously across multiple swing points
Geometric Relationships: Patterns must satisfy complex geometric rules (e.g., X-A-B-C-D structure in harmonics, where each leg must meet specific Fibonacci retracement requirements)
Pattern Persistence: Systems must track pattern state over time, handle pattern invalidation, and manage time-based expiration of anti-signal blocks
Multi-Timeframe Validation: True pattern recognition requires analysis across multiple timeframes to confirm pattern validity
This complexity is precisely why most quantitative trading systems avoid these patterns entirely. The difficulty of implementation becomes our competitive advantage - we have market structure analysis capabilities that most algorithms simply cannot replicate.
ADVANCED FILTERS & SIGNALS
Cycle & Frequency Analysis
Hilbert Transform - Cycle length detection, Real and imaginary components, Phase analysis (teal/maroon/silver fills)
Ehler's Roofing Filter - High-pass filter (48-period default), Super Smoother Filter (10-period, 2-3 poles), Noise reduction for trend clarity
Macro Regime Filters - Huge Edge, many bots can day trade, but can they take the big picture macro enviroment into consideration?
Hidden Markov Model (AI System) - 9-state Gaussian AI machine learning model, Features: Log Returns, Volatility, RSI, MFI, Regime labels: Extreme Bearish → Extreme Bullish, Regime persistence tracking, Transition probability analysis. Essentially, you feed AI years of .csv data, open, high, low, close, returns and indicators and it answers these questions: How long to bear/bull regimes last? What are typical returns? What is the probability of changing or persisting in the current regime. Obviously this is an edge because a human can't meaningfully analyze hundreds of thousands of data points in a giant .csv file. Many indicators say AI because it is a buzzword that sells well, which is true, but their code doesn't actually use AI. This is ACTUALLY MACHINE LEARNING!
Bitcoin Dominance Filter - 2-period EMA of Bitcoin's market cap percentage, Current dominance vs EMA comparison, Blocks buy signals when dominance is above 2 EMA (rising - bearish for altcoins), Allows buy signals when dominance is below 2 EMA (falling - bullish for altcoins), Historical data loaded from CSV for accurate EMA calculation, Daily API updates to track current dominance. This filter helps avoid buying altcoins when Bitcoin is likely to outperform, improving entry timing by aligning with market risk appetite cycles.
Bearish Counter (Extended Downturn Detection) - Unique timing indicator that counts consecutive bearish bars to identify prolonged market downturns:
How it works: Tracks consecutive bars where market conditions are bearish (price below higher timeframe EMA + 0.25 ATR, and RSI(7) below momentum threshold)
Counter logic: Increments on each bearish bar, resets to 0 when conditions become bullish or caution
Trading application: Used in long entry conditions requiring bearishCounter > 300 (default threshold: 300 bars)
Strategy purpose: Identifies opportunities to buy after extremely lengthy downturns, waiting for extended bearish periods before entering long positions - essentially "buying the bottom" after sustained selling pressure
Why it matters: Prevents premature entries during downtrends by requiring confirmation of a prolonged bearish regime, helping to time entries when markets are oversold and potentially ready for reversal
Hidden Markov Model (AI Regime Detection) - 9-state regime detection, Gaussian emission probabilities, Bayesian Information Criterion (BIC) for model selection, K-Means clustering for regime labeling, Feature standardization (StandardScaler)
TIMING & FILTERS
Time-Based Filters
Day-of-Week Filter - Friday block for buy entries, Sunday night avoidance for shorts
Bar Confirmation - 1-bar delay for signal confirmation, Barstate.isconfirmed requirement
Cooldown Periods - EMA+JSON cooldown: 360 minutes, Per-symbol execution tracking
Risk Management Filters
Monte Carlo Skip - Probabilistic trade skipping (0-100%), Random spread application
Position Filters - Flat position requirement for new entries, Bars in position tracking, Bars since no position tracking
Profit/Loss Filters - Trade profit percentage tracking, Minimum profit threshold (0.50%), Maximum loss threshold (-1.0%), Average take profit (6.59% in bear markets)
TradingView signal that passed a second round of filtering in our Python algorithms.
Additional confirmation from moving averages, volatility analysis, and risk parameters must all align.
⭐⭐⭐ ULTRA HIGH CONVICTION
Source: AI extreme regime + MACD alignment + Volume > SMA + cooldown Rarity: Only triggered in the strongest market conditions
The 9-state Hidden Markov Model flags an extreme bullish/bearish regime, then we additionally require MACD in the same direction, above-average volume, and the HMM cooldown to allow it. TradingView confirmation isn’t required for these, but momentum/volume and cooldown are.
⭐⭐⭐⭐ BEST CONVICTION
Source: TradingView + AI confirmation (maximum confluence) AI layer: 9-state Hidden Markov Model analyzing market regime
The highest conviction signals. Both TradingView's 100+ technical indicators AND the AI system agree on the signal direction.
This maximum confluence means the AI analyzes market structure, volatility patterns, and regime shifts
to confirm that TradingView's setup is legitimate. The combination of both systems creates the most reliable signals.
💡 How to Use the Conviction System
Position Sizing - Consider larger positions on higher conviction signals (still maintain proper risk management)
Entry Timing - Standard signals may benefit from additional confirmation time.
Risk Tolerance - Conservative traders focus on Ultra High and Best; aggressive traders can trade all levels
Track Performance - Monitor which conviction levels work best for your trading style and market conditions
No Guarantees - Higher conviction = higher probability, but no signal is perfect. Stop losses, especially trailing, ATR-based stop losses are highly recommended, unless you have a good reason not to do so, such as having an extremely long time horizon.
This comprehensive approach ensures that only high-conviction signals with multiple layers of confirmation are generated, reducing false signals and improving trade quality.
💡 Other Tips & Tricks
1. 💰 Liquidity Providing - Own the Casino
Liquidity providing can be very lucrative. This is when you use a self-custodial account to be your own market maker. Two coins are needed, and one of them could be USD stable coin.
A beginner setup would be $100 of WETH and $100 of USDC. Every time people trade, it collects fees, leading to APY from 8% to 1200%+. Essentially, don't be a gambler, own the casino instead.
The downside? You may end up entirely in the under performing crypto, but if you keep an eye on it, you could always just readjust that. I recommend MetaMask and Uniswap as the way to do this for a beginner, as that is where this concept originated from. Same concept applies to most other blockchains though.
2. 🔒 Hardware Wallets & Security
If you have a large portfolio, consider getting a hardware wallet, with Trezor being the most trusted company.
Also consider getting a fireproof safe and keeping your passwords inside of it. Or buy a specialized steel cylinder from Trezor that is designed to punch your passwords into steel.
Remember: There is no help desk in crypto, so if you lose your passwords, there is nothing that can be done. You are the bank.
3. 💸 Use Coinbase Advanced Instead of the User-Friendly Version
Trading fees are nearly 10x cheaper!! Coinbase Advanced (formerly Coinbase Pro) offers significantly lower trading fees compared to the regular Coinbase platform. If you're making frequent trades, the savings can add up quickly and significantly improve your overall returns.
📥 Optional Code to Download
Access premium trading code and unique indicators for pinescript. I'm choosing to upload pinescript first because it is low risk of me hacking you. It just gives signals on tradingview.com no connection of brokers or wallets.
📌 Note: The code provided here is written in PineScript, which is proprietary code designed specifically for TradingView users. This code is ideal for TradingView platform integration. If you need to adapt it for other trading platforms or languages, you can easily convert it by running the code through AI tools (such as ChatGPT, Claude, etc.) and asking it to translate the logic to your desired language or platform.
💬 Assistant
Hello, I am your assistant on this website. I am programmed to be especially good at answering finance and music questions, using context from this website.
What are today's top 3 buys and sells?
Do you have an arrangement for any songs written by The Beatles?
What assets are inside the ETF XLE?
What letter names are inside A harmonic minor?
🎹 MIDI Tools
All-in-one Python scripts: interactive menu or command-line. Paths with spaces are supported.
MIDI_manipulator_MASTER3.py
Single file for .mid: merge tracks, raise notes below min pitch, remove unisons and redundant pitch classes, quantize (whole–32nd), add guitar string or finger labels. Run with no arguments for an interactive menu, or use -i / -o and flags (e.g. --merge-tracks, --min-pitch 40, --remove-unisons, --quantize sixteenth, --auto-number). Requires: pip install mido.
Single file for MusicXML: merge parts, lift pitch, remove unisons and redundant pitch classes, quantize, add text (lyric/expression/fingering/articulation), auto guitar string or finger numbers. Run with no arguments for an interactive menu, or use -i / -o and flags (e.g. --merge-parts, --min-pitch 40, --remove-unisons, --quantize sixteenth, --add-text, --auto-number). Requires: pip install music21.